Performance comparison
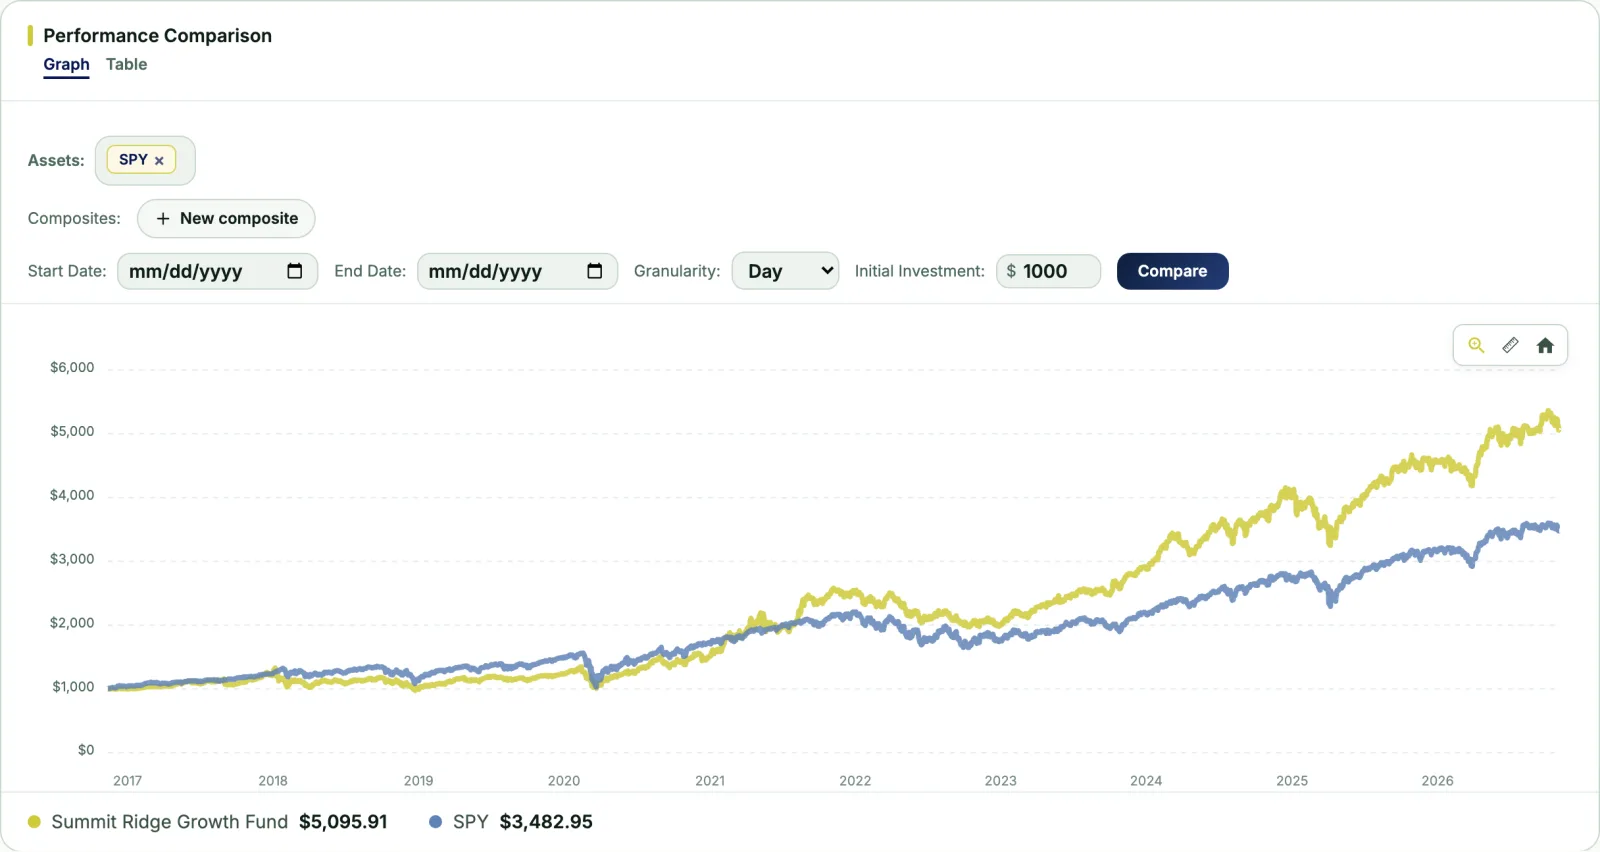
Show the growth of an initial investment in your fund against benchmarks like SPY. Switch between chart and table, adjust assets and starting amounts.
Reporting and Analytics
Generate investor statements, performance comparisons, and custom dashboards from the live ledger. No batch jobs, no cut-off dates to wait for. What used to take your team days now takes minutes.
Minutes
To produce a statement
Benchmarks
SPY and more, side by side
Any window
One month to inception
All featuresReporting and Analytics
What you get
Show the growth of an initial investment in your fund against benchmarks like SPY. Switch between chart and table, adjust assets and starting amounts.
Capital account statements, quarterly reports, and notices generated from the ledger and published to the portal.
AUM, committed capital, fees, and realized and unrealized gains charted from inception to today.
Asset distribution and ownership percentages on any date, filterable by asset type and date range.
Performance comparison
The performance comparison view charts the growth of an initial investment over time across your fund and the benchmarks you choose. Investors and managers can switch between graphical and tabular data and adjust the parameters for a comparative analysis.
Questions
Investors see their own performance, holdings, and documents in the portal and app. Fund-wide reporting stays with the manager.
SPY is built in, and additional market-priced benchmarks can be configured for your fund. Ask during a demo if you need a specific index.
Easefolio produces the clean, reconciled data and investor-level reporting that filings are built from. Your compliance team or counsel completes the filings.
Get started
Book a demo and we will walk through the reporting views with your fund structure in mind.